Visual Studio Debugging - Execution Flow tools
The most used part of the Visual Studio debugger is its ability to control execution flow.
Visual Studio lets you pause and resume your program, either manually, by hitting the pause ( ) or start/resume ( ) or start/resume ( ) buttons, or in a controlled and automatic way. It can resume execution for a single line of code and then pause again ("Step Over," ) buttons, or in a controlled and automatic way. It can resume execution for a single line of code and then pause again ("Step Over,"  ), it can resume and then pause again either after the current line or at the beginning of any functions the program enters ("Step Into," ), it can resume and then pause again either after the current line or at the beginning of any functions the program enters ("Step Into,"  ), it can resume and then pause once the current function has exited ("Step Out," ), it can resume and then pause once the current function has exited ("Step Out,"  ), or it can resume and then pause automatically once it reaches the line of code at which you have placed the text insertion point ("Run to Cursor," ), or it can resume and then pause automatically once it reaches the line of code at which you have placed the text insertion point ("Run to Cursor,"  ). ).
When you pause the program, the yellow arrow to the left of the code indicates where it stopped, and you can use the "Show Next Statement" button ( ) to quickly jump back there. There are three other buttons that relate to program flow: "Stop Debugging" ( ) to quickly jump back there. There are three other buttons that relate to program flow: "Stop Debugging" ( ), which forcibly terminates your program and shuts down the debugging tools, "Restart" ( ), which forcibly terminates your program and shuts down the debugging tools, "Restart" ( ), which forcibly terminates the program and then starts it up again, stopping at the beginning of the program's initial function, and "Set Next Statement" ( ), which forcibly terminates the program and then starts it up again, stopping at the beginning of the program's initial function, and "Set Next Statement" ( ). Set Next Statement allows you to jump the yellow arrow to any line of any function in your code, but you need to be extremely careful - it's very easy to break your program's internal state like this, and things are pretty much guaranteed to go wrong if you try using it to jump from one function to another. Unless you understand clearly how the call stack and program pointer work, it's probably best to leave this one alone. ). Set Next Statement allows you to jump the yellow arrow to any line of any function in your code, but you need to be extremely careful - it's very easy to break your program's internal state like this, and things are pretty much guaranteed to go wrong if you try using it to jump from one function to another. Unless you understand clearly how the call stack and program pointer work, it's probably best to leave this one alone.
Those are the basic execution controls. The next step up is to look at breakpoints: points in your code where you want the debugger to automatically pause your program, as if you'd hit the pause button yourself. You can set up as many of these points in your program as you want (though going overboard can cause your program to slow down). In Visual Studio 2005, the breakpoints window looks like this:
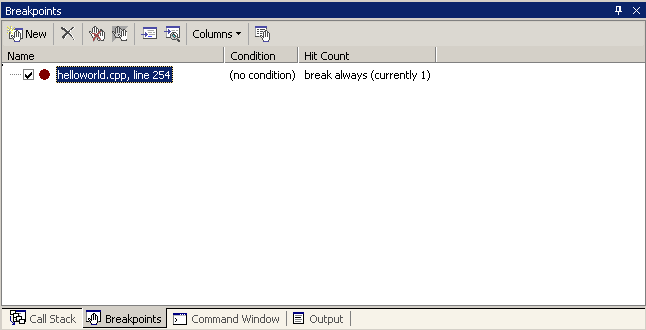
The simplest kind of breakpoint is called an unconditional breakpoint (or more commonly just "a breakpoint"); when the program reaches one of these, the debugger will pause the program, every time. These are the most frequently used type of breakpoint. You can turn one on or off without removing it if you want (the checkbox to the left of the breakpoint), but you have to do that by hand. The simplest way to create an unconditional breakpoint is to click on the grey bar to the left of the line of code where you want to set the breakpoint, or to click in that line and press F9. The breakpoint might not show up exactly where you tried to place it - that's because it must be on a line of code that produces some actual executable statements, instead of on lines such as function signatures or comments.
Slightly more complex are conditional breakpoints. As the name suggests, these are breakpoints that have some particular conditions or qualifiers applied to them; when your program reaches a conditional breakpoint, the debugger will pause the program but only if the conditions are met.
Say you've got a bug in a function which only shows up when the input is negative. If you placed an unconditional breakpoint at the beginning of the function, the breakpoint may be hit in a call to the function that passes a positive value - something you're not interested in. Instead of having to repeatedly break and resume the program until you get a negative value, you could set a condition on the breakpoint (e.g. input < 0) and then the program will only stop when the input variable is below zero. There's a limit to the complexity of the conditions that you can set, but if you stick to simple comparisons and logic then you shouldn't have any problems.
Instead of having the breakpoint happen when the condition is true, you could also have it happen when the condition has changed from the last time the breakpoint was checked. You can also set up the breakpoint to only break on the fifth time, or on every fifth time, or to skip the first four times but break every time after that (the "Hit Count" setting). All of these things can be set up by right-clicking a breakpoint in the breakpoints window and choosing the relevant options.
A new feature in Visual Studio 2005 is the When Hit property of breakpoints. Simply put, you can instruct the debugger to do something instead of pausing the program, like printing the value of some variables to the Output window, or running a macro. You can have it pause as well, if you like. One of the most useful things this feature lets you do is to add debug traces (text messages telling you about the state of the program) without having to change any code or rebuild; that particular aspect is so useful that there's actually a shortcut for setting one up (Insert Tracepoint instead of Insert Breakpoint).
Up to this point we've only considered location-based breakpoints: breakpoints that exist at particular places within the code. There's a second kind of breakpoint known as a data breakpoint. Instead of waiting for the code to reach a particular place before checking whether to stop, data breakpoints continually monitor a variable or location in memory, and pause the program whenever the value stored there changes, no matter where the program is at the time. If one of your variables is mysteriously changing and you can't figure out why, stick a data breakpoint on it. They're very effective when it comes to tracking down things like buffer overruns. All the conditions and filters that you can apply to location-based breakpoints can be applied to data breakpoints too. Data breakpoints have a bit of a reputation for being slow and harming your program's performance; that's only true if the data breakpoint is being emulated, and data breakpoints on the PC in Visual Studio 2005 are no longer ever emulated, they're provided by the hardware.
There's one more feature that involves pausing your program in the debugger, and that's exception handling. If your program experiences an exception that isn't handled - for example, an access violation - then the debugger will always catch it and pause your program. Sometimes you will have inserted code to catch exceptions before they get to that level (try/catch blocks). Yet you may still find that you want the debugger to pause your program even though the exception is being handled - your program has been written to recover from the error, but you'd like to investigate exactly how and why it happened in the first place. You can do this using the 'Exceptions' dialogue in the Debug menu (Ctrl-Alt-E); the dialogue gives you full access to all C++, .NET, runtime, and Win32 exceptions, and you can specify which ones you want it to pause on regardless of whether they have been handled or not.
Visual Studio Debugging - State Inspection tools
So, we've covered how to move the point of execution around, catch it here, throw it up there, pass it under your leg and roll it along your arm, like a small cheese. The next group of tools are used to give you information about the state of the program when it is paused in the debugger - everything from a raw memory inspector to a list of threads and processes.
First, however, we need to cover a key concept on state inspection, the concept of context. When your program is paused in the debugger, there is a huge amount of information that could be reported to you; you've usually got multiple variables across multiple functions, which may be operating in multiple threads, or even across multiple programs on multiple computers. Understandably, that can be quite hard to manage. It gets worse when you consider that the same variable name may be used in many different places (particularly loop variables like i, j, or index). If you tell the debugger you want it to report the value of foo, do you mean foo the local variable in the function you broke the program in, or foo the local variable in the function that called this function, or foo the local variable in the current function of the other thread, or foo the global variable in the other program that you're debugging via the network? To solve this problem, the debugger tracks at all times what it calls the context or frame (of reference), which consists of:
- One program, from which you can choose
- One thread, within which you can choose
- One currently executing function.
You can change which process, thread, or function you want to "talk about" through the processes, threads, and call stack windows respectively, as we'll see in a moment. Bear in mind that the context is a different thing to the program position; you can change the context around as much as you like, but when you allow the program to continue running, it will continue running from the current program position. It's really a lot easier to use than to explain; just be careful that you don't get surprised by data that turns out to be coming from a different context than what you thought you were looking at.
We should also take a moment to talk about symbols. Symbols, as far as the compiler or debugger are concerned, are names of things - functions, variables, classes, etc. One of the things that the compiler and linker do is to fix up all the names you use, replacing them with the actual address of the things you refer to. After they've done that, the names are no longer strictly necessary to have hanging around; in a debug build you'll generally keep them for the debugger's use, but if you're trying to produce the smallest possible executable (as you usually will for release builds), you want the tools to throw them away.
As a result, when the debugger loads up your program to operate on it, most of the names may have been removed - and that, obviously, can make it quite hard to work with. This problem is solved by asking the compiler/linker to create symbol files, which are files that contain all the symbols used in your code, and the addresses of the things they refer to. It's basically the same information that was used by the compiler and linker, but instead of storing it alongside the code and then throwing it away, it gets put into an entirely separate file throughout the process. Your executable is still of minimum size but you get to keep the symbol information.
When you ask the debugger to show you the contents of variable foo, it can look up foo in the symbol file, get the address of it in memory, and get the result from that address. Under Visual Studio, symbol files have the extension .PDB, and can be turned on and off in the project property pages - you need settings both in the C/C++ "General" page ("Debug Information Format," with "Program Database for Edit & Continue" being the most comprehensive), and in the Linker "Debugging" page ("Generate Debug Info"). Generating symbol files has no impact on your application's performance; it only takes a little time during the compile and link steps. If you find yourself looking at utter gibberish with lots of hex numbers and assembly codes, then chances are you don't have symbol files for what you're looking at, so Visual Studio can't convert what it's seeing into a more readable format for you. Microsoft run a 'symbol server' that provides symbol files for Windows DLLs, if you need them; information about how to have Visual Studio download these symbols is available from MSDN.
Now, onto the tools themselves. The majority of these are accessible via the "Windows" submenu in the 'Debug' menu. The first of these are the watch windows (Alt-3).
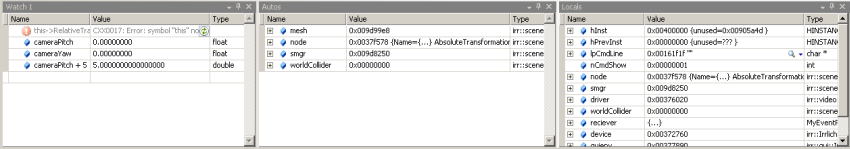
The watch windows display various expressions, and what they evaluate to in the current context - there's one that displays your local variables (Locals, Alt-4), one that guesses at what you'd like to know based on the current chunk of code (Autos, Ctrl-Alt-V) , and four that display expressions of your choosing (called Watch 1 through Watch 4). The expressions are re-evaluated every time the program stops or every time the context changes, so you can watch how expressions change as you step through a function. The evaluator can understand a decent range of expressions, including arithmetic, casting, assembly registers, and pointer math, so you can happily use expressions like (DWORD*)ptrVar[index] + 5 or this->pBitmap[10][10] if you want. Also, you can mess with the way in which the watch displays those values - MSDN describes "Format Specifiers" you can apply to individual expressions by sticking a little typecode on the end; and if you're working with integers, you can right-click the window and turn on 'Hexadecimal Display' to have those integers displayed in hexadecimal format.
To further extend the power of the watch, if the expression you enter is something to which you could assign a value in code (i.e. if you could write watch_window_expression = value in your source and it would compile OK), then you can assign to it in the watch window. This is great for tweaking things - you can just pause the program, have the relevant variables as individual expressions in the watch window, adjust the values, and hit continue to see the effect. Be careful that you don't make your program state invalid in the process; imagine that you've got an object which contains a string array, and a value that is the length of that string. You shouldn't change one without changing the other, but the watch window would let you do that, possibly leading to behaviour which appears to be buggy but in reality could not actually happen.
Visual Studio also includes a sort of "portable watch" system that displays the value of variables in tooltips that pop up as you hover the mouse over your source code. In VS.NET 2005 the system has been upgraded and renamed to DataTips, and now can be expanded to show you submembers in the same way as watch window expressions.
The second commonly-used state inspection tool is the call stack window (Alt-7).
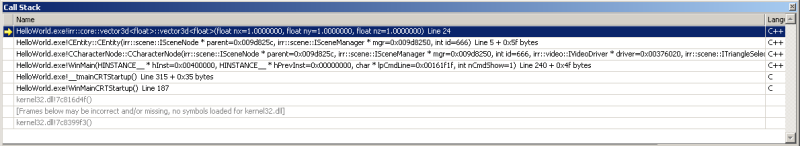
As the name suggests, it displays the call stack: the set of functions that the program is currently "inside." As functions get called in your program, they get added to the top of the call stack, and when the function exits it is removed again. The picture here shows that the process started down inside kernel32.dll, which contains functions (ones we don't have symbols for) that called WinMainCRTStartup() inside my HelloWorld.exe program. WinMainCRTStartup() then called _tmainCRTStartup() - both functions are provided by the runtime libraries - which then called WinMain, the first function in the stack that is actually part of my code. My WinMain function has called the CCharacterNode constructor, which has called the CEntity constructor, which has called Irrlicht's vector3d<float> constructor. Why is this interesting information? Because frequently a bug will only appear in a function when it is called in a specific way, and looking at the call stack tells you which function made the current call, so you can check that function out to see what's special about the way the call has been made.
Notice that as well as the module and function names, each entry in the window also tells you the parameters that were passed to the function. This can be extremely handy; it can, at a glance, show you how a value such as a null pointer has percolated to a position at which it is causing a problem. Chances are that in such situations the problem lies deeper in the call stack than you might otherwise have thought.
Double-clicking an entry in the call stack will change the context to that function; bear in mind that only the stack for the current context's thread is displayed, and other threads have entirely separate stacks. If you don't see a function that you expected to see, check the Threads window (see below) to make sure you're looking at the right thread.
The call stack window also provides a quick way of doing "step out" over multiple functions: just right click the function you want to come back up to, and choose 'Run to Cursor.' The program runs until all functions above that one in the stack have returned.
The next parts of the debugger tend not to be so frequently used, but can still be extremely useful. This is the modules window (Ctrl-Alt-U).
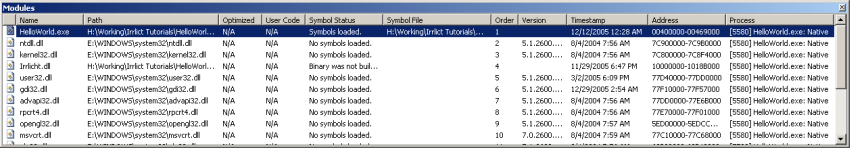
The modules window displays all the code modules - mainly EXEs and DLLs - that the debugger's collected information about, because they're used (maybe indirectly) by the thing you're debugging. Using this window can help you catch mistakes like loading the wrong copy/version of a DLL. It also allows you to check on the state of the symbol files for each module.
The processes window (Ctrl-Shift-Alt-P) shows you all the processes that the debugger is attached to:
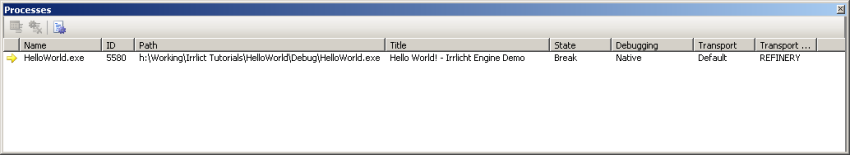
It's not generally that useful unless you're debugging multiple programs at the same time - something I rarely find I need to do - but if you are doing it, then double-clicking an entry will set the context to that process. It lets you review the way in which you're attached to processes such as native code versus .NET code versus ASP code, debugging on your own machine versus debugging a program running on another machine, etc. You can also find the 'Attach to Process' button here (Ctrl-Alt-P) that you can use to attach the debugger to a program running on both your machine and on network machines. This can be handy if your program has hung and you didn't have the debugger attached.
Related to the processes window is the threads window (Ctrl-Alt-H):
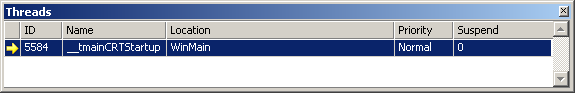
It simply lists all the threads in the current context's process, lets you change the current context's thread by double-clicking, and allows you to pause ("freeze") and un-pause ("thaw") them. Most threads don't have names, and it's generally not something to worry about, as the names are only ever visible to the debugger; however, if you'd find it useful, then there's a SetThreadName function demonstrated in MSDN. The window also displays the topmost function in that thread's call stack, the priority that the operating system has assigned to the thread (usually just Normal, but you can request that a thread have higher or lower priority), and whether or not the thread has been paused by your code.
Be aware that while your own program may not use threads, it may deal with other technology - such as DirectSound - that does create its own threads within your process.
There are just three more windows to cover in our whirlwind tour of the state-inspection tools. They're the most low-level (and in my experience, least frequently used) tools, but they do still have their moments. First up, the memory windows (Alt-6):
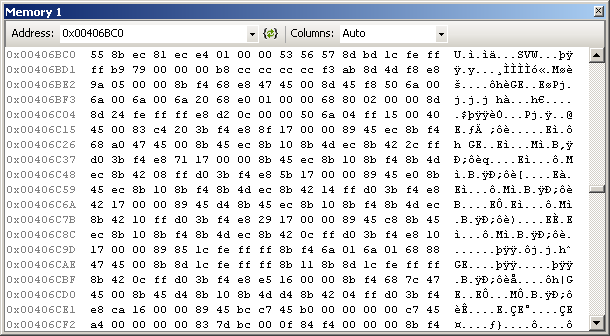
Exactly what it says on the tin: It shows you the contents of memory, on a byte-by-byte level; right-clicking the window lets you choose from a number of different formats for the data, so you can have it presented as 4-byte integers, as floats, you can make it big-endian or little-endian, etc. Like the watch windows, you've got four you can use and set up independently. You can even edit values in memory, though it's very easy to break things by doing so.
This is the registers window (Alt-5)
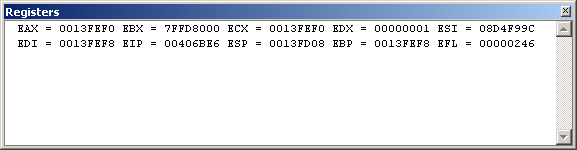
It shows you the value of the hardware registers available to your program. Don't be fooled by the fact that it looks mostly empty - by default, only the main CPU registers are set to be visible. If you right-click the window, you'll get a popup menu that allows you to turn on other sets of registers, such as the x87 floating point registers or the SSE registers.
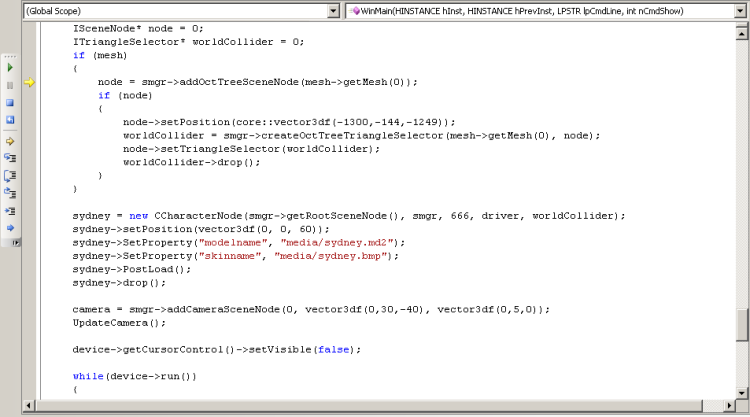
Last, but not least, the disassembly view (Alt-8) allows you to see the machine-code instructions that the compiler has generated from your code:
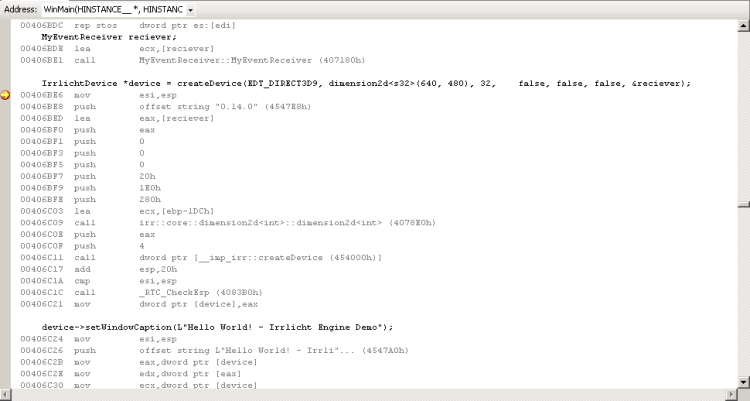
The disassembly view will do its best to match up the code you wrote (in black) to the machine-language section that your code corresponds to (underneath it, in grey).
However, if you've turned on optimizations - or any other option which would involve reprocessing or reordering the assembly - then what it ends up showing you may not make much sense. The code should still behave in the same way, and might still be packed inside the right function, but some lines of code may be accompanied by apparently unrelated assembly, while others may have no assembly listed for them at all. As such, if you need to use disassembly view for any extensive work, you probably want to turn off optimizations first (or switch to a build profile that doesn't have them turned on, like Debug). Be aware that if you do work in Debug mode, you may see some strange symbols appearing that seem to have nothing to do with your code - they tend to be runtime checks inserted by the compilers to verify that particular things have not entered invalid states (the sort of checks we talked about in the Issue Recognition overview). For example, in the image above you can see a call to _RTC_CheckEsp near the bottom - that's something the compiler has inserted to check that the createDevice function has returned correctly and not messed up the call stack.
Much like the regular source view, disassembly view also supports breakpoints - unlike source view, they can be set on individual instructions, instead of only on lines of code - and DataTips, if you mouse over registers or variables.

Other Tools
|
|