Visual Studio Debugging - Other Tools
There's two more parts of the Visual Studio debugger that should be mentioned, but they don't really fit into the program flow or state inspection categories. The first of these is the output window:
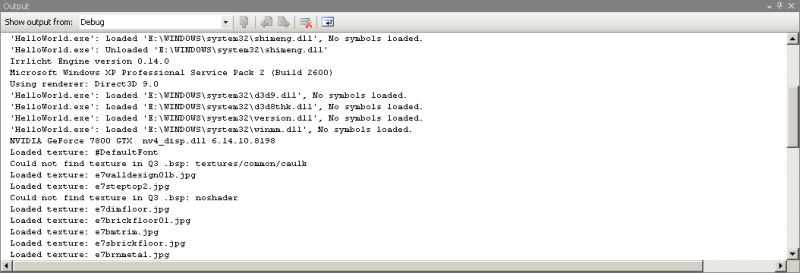
The output window is a general dumping-ground for messages generated by your program (and by things your program uses, like parts of Windows). These messages can be about anything; often errors will display a message giving you more information about the error than you might otherwise get from things like function error codes. DirectX does this on a particularly regular basis, if you turn on the debugging mode in the DirectX control panel. Messages generated by tracepoints also go here. You can have your own program write messages into this window, if you want; in unmanaged C/C++, the function is called OutputDebugString(), while in managed languages you want to use the System.Diagnostics.Debug and System.Diagnostics.Trace classes. It's actually the same window as is used for compiler/linker output - see the "Show output from:" dropdown at the top there?
The other window we want to look at is the immediate window:
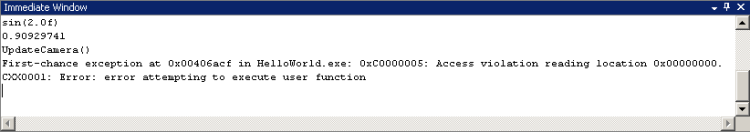
The immediate window is a bit of an oddity. It sort of feels like it's been inherited from older, command-line debuggers. Simply enough, you give it an expression (including assignments and function calls if you want), it evaluates it and displays the result. Sounds pretty similar to the watch window, no? The difference is that what you put in gets evaluated once and only once, instead of every time the context changes. As such it can be quite handy for doing things like calling complex setter functions. The window also supports a group of single-letter debugger commands, like X to search for a symbol and K to display the call stack. The full list is in MSDN.

Diagnosis and Prescription
|