Critical Path Analysis: Step 7
You've now finished with the actual CPA algorithm, and now you're moving on to synthesising the data you've gathered from using the algorithm. The most popular and easiest method of doing this is through scheduling, which is usually done by Gantt charts.
Designing Gantt charts and scheduling using them is done purely by eye there is no magic algorithm to find the most optimal pattern. It does have it's weaknesses though; one particular example is specialist skills. The algorithm doesn't take into account any differences between the workers. For example, Bob can't do graphics engines, but can do general programming. You may well find that the optimal route only works properly in some cases where there is always someone who can do the task at the given time; if there isn't then you have to wait until someone is available and this could delay the project.
The first part of a Gantt chart is to plot all the activities in the correct positions. You'll use two rows for each activity one being the earliest start/completion, and the second being the latest start/completion. The end result will look something like this:
- The earliest start of an activity is the earliest arrival time at the event before
- The earliest finish of an activity is the earliest start time + duration of the activity
- The latest start time of an activity is the latest arrival at the destination event duration of the event
- The latest finish time of an activity is the latest start + duration of the activity
Therefore the completed table for the earliest start and earliest finishes is:
| Activity |
Earliest Start |
Earliest Finish |
Latest Start |
Latest Finish |
| A |
0 |
14 |
0 |
14 |
| B |
14 |
19 |
19 |
24 |
| C |
9 |
14 |
19 |
24 |
| D |
14 |
24 |
14 |
24 |
| E |
24 |
55 |
24 |
55 |
| F |
55 |
62 |
55 |
62 |
| G |
0 |
14 |
48 |
62 |
| H |
14 |
35 |
62 |
83 |
| I |
0 |
14 |
5 |
19 |
| J |
0 |
9 |
10 |
19 |
| K |
62 |
83 |
62 |
83 |

From this graph you can see the earliest and latest times that you can start activities. Each little block can be moved backwards and forwards as long as it's always after the earliest start time and before the latest start time. It is this fact that allows you to do the next part: scheduling.
Scheduling is where you shuffle all the little blocks around to form the most efficient way of completing the project. This is where it gets complicated. You must do it by eye, as mentioned: there is no algorithm to do it for you. There is often more than one possible arrangement, and you also have to take into consideration any skills based factors (can Bob actually do this task?). The first step is to redraw the Gantt chart so that you have people down the side (instead of activities). You can go about it two ways from here either to use up all the available people, or try to arrange it so that you use as few people as possible (yet the few people you use are always busy). For this example we're going for the latter approach.
To get things started it's easiest to assign the first person to do all the critical activities. This person will then always have something to do, and it reduces the amount of juggling you have to do. The following diagram is one possible way of organising things:
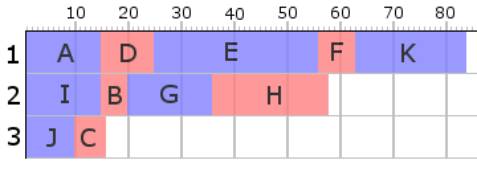
It's a bit annoying organising the I-B and J-C pairs; both have to be completed before E (on the critical path) can be started, yet you can't arrange them so that only one person does them. You could (in a real world situation) have persons 1 and 2 full time team members, and make person 3 a temporary person once they've done tasks J & C they go away again
Conclusion
I hope this article has been of some use to you. As you've probably already noticed, this method has limited use for a one-person development team, and even with a multi-person team it still has its weaknesses. But ignoring those you can still get some very useful data from spending half an hour with this algorithm.
Feel free to email me with any questions, comments or otherwise: jollyjeffers@Greenonions.netscapeonline.co.uk, or visit my site: www.vbexplorer.com/directx4vb/ for more tutorials and theory pieces
|